Written by: Adam Tzur
Last updated: 25.07.2022


Steve Hall of Revive Stronger has interviewed Adam about research limitations. Watch the video or read the article to learn more about exercise science.
The interview covers the following topics:
00:00 Philosophy of science
04:08 Study vs. anecdotes
05:51 Survivorship bias
11:52 Length of studies as a limitation
16:57 Number of participants and statistical power
19:33 Demographic
23:22 Adherence of participants
26:53 Having a coach?
29:02 Measuring tools
33:33 Funding bias
37:53 Personal biases
47:13 Core principles of science
49:22 Animal studies

Summary of Research Limitations
Genetics
Genetics as well as our life situation affects how well we adapt to a training program. Some people are low-responders (slow gains), others are high-responders (fast gains).
Duration
Many fitness and nutrition studies are short (i.e. 8 weeks). Results from an 8 week study do not necessarily apply to longer periods of time, like a year.
Representativeness
Most strength studies recruit untrained male university students in their early 20s. This limits representativeness, because study results apply to the population in the study.
Specificity
Many studies use programs that involve a single muscle group being trained (isolation training). The results then apply only to that muscle group.
Adherence
Participants in training studies are often under direct supervision of study coaches when they train. This affects adherence (how likely they are to show up).
Body composition measurements
Machines like DEXA or BIA have inherent error margins. Results are affected by water retention, carbohydrate intake, muscle glycogen, supplements, and more.
Dark side of science
Some researchers miscite (misquote) other studies, or use animal studies to make claims about what works for humans. Sometimes, peer review is faked, or funding bias affects the results.
How to interpret scientific literature
We should have high standards and base our conclusions on the preponderance of the evidence from systematic reviews and meta-analyses.
Overview of research limitations in fitness science
Genetics and individual variability
Does everyone respond the same way to the same training program?
If we look at the figure below; the change in CSA (hypertrophy) after 12 weeks of strength training seems clear.
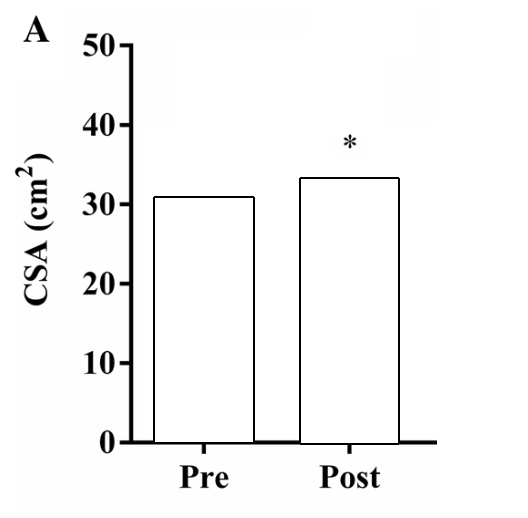
Figure by Angleri et al. (2017) (edited for clarity).
Should we assume from this that everyone who does strength training for 12 weeks will increase their CSA by ~3-4cm2? It seems like a straightforward conclusion no? Not so fast!

Figure by Angleri et al., (2017) (edited).
Once we bring in inter-individual variability, we see that the answer is much more complicated. Some individuals barely improve while others improve at a much faster pace:

Figure by Angleri et al., (2017) (edited for clarity).
There’s even something called a non-responder. Below is an example from a 9 month strength training study (8 out of 83 beginners maintained or lost LBM). We could argue the participants who didn’t gain had diseases or inadequate recovery (i.e. poor sleep), but it remains speculative:

Figure from Volek et al., 2013
Why is there so much variation? Why can’t we all improve at the same rate? Some researchers believe this is due to genetics and epigenetics which are affected by lifestyle factors (i.e. diet, sleep, life stressors, pollution of the environment you live in, differences in training programs, etc.) (Simoneau and Bouchard, 1995; Mead, 2007; Bamman et al., 2007; Liu et al., 2009; Erskine et al., 2010; Puthucheary et al., 2011; Hughes et al., 2011; Ahmetov et al., 2012; Thalacker-Mercer et al., 2013; Guth and Roth, 2013; Kim et al., 2014; Mann et al., 2014; Schutte et al., 2016; Zarębska et al., 2016; Ahtiainen et al., 2016; Klimentidis et al., 2016; Broos et al., 2016; Gineviciene et al., 2016; Heffernan et al., 2016). Your genetic profile interacts with the environment to create a unique phenotype (Denham et al., 2013; Schlichting and Wund, 2014; Hoppeller, 2016; Schutte et al., 2016). Different phenotypes have different responses to training.
We usually divide people into low-responders and high-responders (Hubal et al., 2005; Davidsen et al., 2011; Mann et al., 2014; Parr et al., 2016; Ogasawara et al., 2016; Bonafiglia et al., 2016; Buckner et al., 2017).
“Diet- and exercise-based weight loss interventions result in large variability in responses between individuals that is often under-reported (…) This study provides new information demonstrating that the abundance of [microRNA] are modulated with exercise and diet, and [they] are differentially expressed between high and low responders before and after a chronic weight loss intervention.”
Parr et al., 2016

Figure by Parr et al., 2016 shows us differences in lean body mass gain after 12 weeks of strength training.
Furthermore, it’s possible that some people respond better to certain types of diets or training programs (Kikuchi and Nakazato, 2015; Parr et al., 2016; Jones et al., 2016; Bonafiglia et al., 2016). For example, you might be a high-responder to low volume high intensity training, but a low-responder to high volume low intensity training. This is something we need to account for when designing training programs, and it’s very easy to misinterpret study results as something that has to apply to everyone.
“In resistance training for hypertrophy, we propose that individuals with ACTN3 RR or RX genotypes who have relatively high strength and power should choose high-load low-repetition resistance training. In contrast, individuals with the XX genotype of ACTN3 should prefer a low load with high repetitions.”
Kikuchi and Nakazato, 2015
Study duration and long-term effects
A limitation with many studies, in particular periodization studies, is their short duration (most training studies are 6-12 weeks long). Generally speaking, it takes 2 months to be able to tell whether a study leads to detectable and statistically significant hypertrophy gains. Sadly, most studies in this field are very short. It’s common in the periodization literature to say no difference was found between programs, but those differences might show themselves if the program was longer. So just because a study didn’t find significant gains, doesn’t mean that wouldn’t happen in a longer study with more subjects.
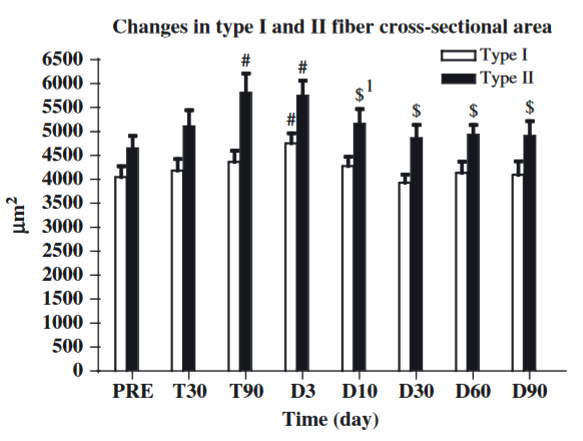
Figure by Jespersen et al., 2011: it took 90 days (~13 weeks) to show significant hypertrophy beyond baseline with MRI CSA. It should be said that many studies find significant effects before this time. It depends among other things on the effectiveness of the training protocol as well as statistical power and participant number.
Beyond the short-term, it’s also possible that a certain program would become worse after a while. Let’s say training to failure every set is superior for 6 months. It’s possible this strategy would become less and less effective after this point in time, and that some sort of failure periodization would be necessary to continue optimal progress. We can’t tell whether this is the case with most studies today, because of their short duration.
Representativeness and convenience sampling
Many if not most fitness studies use convenience sampling to recruit participants. 20-something university student males are by far the most common participant type, though there are studies on elite athletes and older people as well. Women rarely participate. This limits representativeness. It’s possible people of different ages and genders would respond differently to the same training program or diet. For example, older people might be at greater risk of injury, hence they might want to train with lower intensities and not go to failure because failure increases injury risk. This might be a non-issue for younger lifters. There are also issues of anabolic resistance when it comes to age.
It’s important to note that there are gender differences in terms of total muscle mass and muscle distribution throughout the body. Men have more total muscle mass than women (Abe et al., 1998; Janssen et al., 2000; Abe et al., 2003; Zheng et al., 2013; Healy et al., 2014). Hence, putting women and men together in the same study groups could lead to very large standard deviations in terms of total mass and strength.
“Whereas the women in the present study had 40% less muscle than men in the upper body, in the lower body gender differences in muscle mass were only 33% (…)”
Janssen et al., 2000
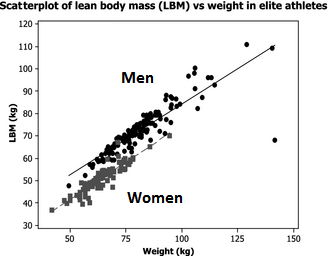
Figure by Healy et al., 2014 (edited): “Women had a lean body mass 85% that of men”
There seems to be disagreement in the literature whether the two sexes gain at the same pace or whether one sex gains faster than the other (Ivey et al., 2000; Hubal et al., 2005; Liu et al., 2010; Ribeiro et al., 2015; Ahtiainen et al., 2016; Da Boit et al., 2016; Gentil et al., 2016; Mata et al., 2016). But the sex differences (such as differences in total LBM) do partially explain why men outperform women (Healy et al., 2014).
Heterogeneity and specificity
The different methodologies, sample sizes, training programs, statistical methods, body composition measurement tools, durations, participants, etc. make the studies different from one another. This is called heterogeneity and it means that the studies are so different that it’s hard to directly compare them. Though it should be said that studies don’t need to be perfect replications of each other to compare them. But, they should have most variables be the same so that we can actually figure out which variable it is that is responsible for the change we’re looking to measure.
This also ties into how specific study results are. For example:
- Study A: 10 participants, male, untrained, 6 week duration, testing isometric strength, uses machine exercise, with protein supplement, concludes that it’s ideal to train a muscle group 5 times per week for maximal hypertrophy development.
- Study B: 30 participants, female, trained, 10 week duration, testing dynamic strength (1RM squat), no protein supplement, concludes that ideal training frequency is 3 times per week for maximal hypertrophy development.
So, which one of these is correct? What is the ideal training frequency? The answer is: neither. Like I mentioned, a study’s result is highly specific to the protocol within which it is used. So if you’re a trained female looking to improve your squat 1RM over a 10 week period, study B is much more applicable to you than study A. If you’re an untrained male looking to improve isometric strength using machines, then the results of study A apply to you.
This is something that is frequently overlooked when talking about studies, and it’s very easy to get the wrong picture if you just read the abstract. The abstract won’t always mention whether the participants are trained or not, sex is usually not mentioned either. And I’ve found that a surprising amount of studies will “hide” the fact that they only used isometric strength testing to assess strength. Isometric strength is basically when you hold a contraction without moving the limb/muscles that are under load. Isometric strength does not necessarily transfer to dynamic strength (contracting muscles through concentric and eccentric range of motion).

Illustration by Boundless (2016) (edited)
Another issue is that many studies will use machine exercises. And as we know, strength is highly specific to the movement, contraction type, ROM, etc. that is being performed (Morrissey et al. 1995; Beardsley, 2015; Pritchard et al., 2016; Rhea et al., 2016) (we have an article on this in the works, will be published in a couple of weeks). So if a study concludes that a certain type of training is ideal for machine exercises, it doesn’t automatically mean this applies to a person doing barbell movements or free-weight exercise.
Though it’s surprising how many studies will try to generalize specific results into something that becomes speculative.
Ecological validity
Ecological validity means the study mimics real life. Some studies will only test two exercises versus each other. And the subjects will do no other exercises during the study. Let’s say you want to see what’s best: barbell bench press or dumbbell bench press? Group A only does barbell BP while group B only does dumbbell BP. The study finds that the barbell BP was superior for building muscle and strength. The problem here is that this effect may not exist in a normal training program. If subjects do a bench press plus other chest exercises, the effect of barbell vs. dumbbell could be negligible.
This type of reductionism is necessary in science but it might not apply to people in real life.
Hence, if you want to compare two exercises in an ecologically valid study, you should do it in the context of a complete training program.
Here’s an example of a study that aims for ecological validity:
- Effects of a Modified German Volume Training Program on Muscular Hypertrophy and Strength (Amirthalingam et al., 2016)
Adherence to training and gains
Training adherence (how closely you stick to a training program) is an important factor. It generally determines how well your strength and gains improve over time. This is also common sense, since skipping practice isn’t generally considered the best way to make progress. Though there are exceptions (i.e. overtraining, and complete beginners).
Training that is supervised by coaches could lead to greater gains compared to training by yourself, because subjects in studies might adhere more closely to the program and exert more effort (Mazzetti et al., 2000; Coutts et al., 2004; Gentil and Bottaro, 2010; Amagliani et al., 2010).
It’s possible normal people would not push themselves as hard when they’re training alone and they might be more liable to skip workouts. Low training attendance might lead to slower gains (Gentil and Bottaro, 2013). Though it depends on which group of people we look at. Complete beginners could take long training breaks and still rival the gains made by beginners who train continually (Häkkinen et al., 2000; Ogasawara et al., 2011; Ogasawara et al., 2013):
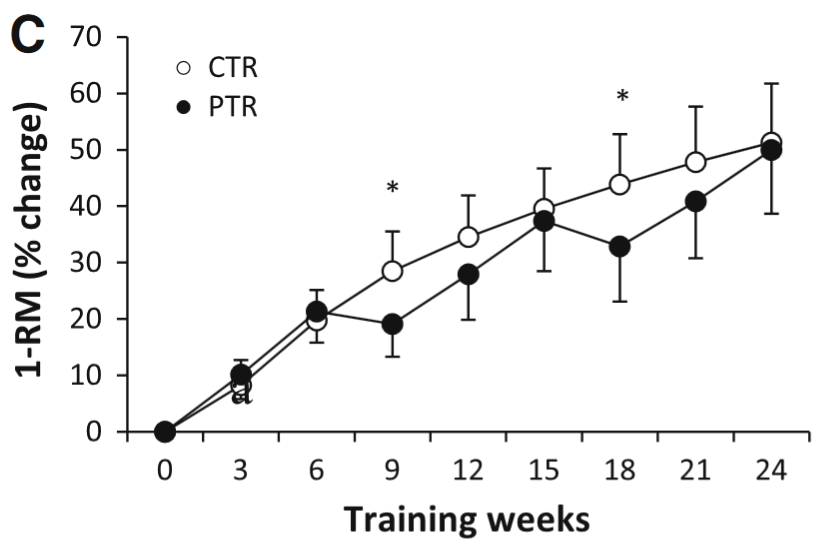
The figure shows how 1RM changes over the course of 24 weeks of training. The black lines (PTR group) trained for 6 weeks, then took a break for 3 weeks (rinse and repeat). The white line (CTR group) trained continuously. By the end there was little difference in maximum strength between groups. Figure by Ogasawara et al. (2013).

The figure shows how CSA [hypertrophy] changes over the course of 24 weeks of training. The black lines (PTR group) trained for 6 weeks, then took a break for 3 weeks (rinse and repeat). The white line (CTR group) trained continuously. By the end there was little change in gains. Note that the CTR group did a lot more volume because they never took a break: “the PTR group had 25 % fewer training sessions”. Figure by Ogasawara et al., 2013.
Hence beginners might not need perfect adherence to training. Though we can speculate that adherence is more important for trained lifters or for beginners who are doing whole-body programs (participants in the Ogasawara study didn’t do a whole body program).
Funding bias
Does funding imply bias? Should a study be discarded on the basis of funding alone? I will argue both sides of the issue:
Why funding doesn’t affect the results of a study
- Methods section is more important: How rigorous was the study?
- Many journals require Conflict of Interest (COI) to be disclosed
- A researcher risks his entire career by forging data/lying so that a study conforms to the expectations of the funder. If it is later discovered that he or she forged data, they might lose their job and reputation.
- Many studies have multiple funding sources, including state grants and self-funding by large universities. Multiple funders reduce the chance that a single funder “decides” the outcome.
- Several journals report that the funders had no hand in the design of the study or in the presentation of the results.
- Several of the most important and influential nutrition researchers are partially funded by the industry. Would people suggest that for example, Stuart Phillips, a highly regarded protein researcher, is corrupt because of prior funding? That’s quite a claim.
Why funding does affect the results of a study
- Conflicts of interest/funding are omitted from quite a few studies/books (Roseman et al., 2011; Piper et al., 2015; Rasmussen et al., 2015; Resnik et al., 2017)
- Several reviews suggest that funding bias might influence study results (Lexchin et al., 2003; Huss et al., 2007; Lundh et al., 2012; Flacco et al., 2015; Shnier et al., 2016; Schillinger et al., 2016; Chartres et al., 2016). Though some disagree (Mugambi et al., 2013). It might depend on which industry and field we are discussing (some fields might be inherently more at risk for funding bias). It seems like pharmacology is such a field.
- There are studies that are undertaken on behalf of a company that specifically produces, markets, and sells the product that is being tested. A dead giveaway is that the study has 0 citations even if it’s several years old. Perhaps it is only cited by the same authors. Examples: Oben et al. (2008) followed by Anderson (2013)
“In conclusion, an appreciable portion of the content in pharmacology textbooks is open to the influence of undisclosed potential financial conflicts of interest. These resources are frequently consulted by many practicing physicians as well as other allied health professionals and are also integral to their education.”
Piper et al., 2015
“In 75.0 % of guidelines at least one author, and in 21.4 % of guidelines all authors, disclosed FCOI with drug companies. In 54.0 % of guidelines at least one author, and in 28.6 % of guidelines over half of the authors, disclosed FCOI with manufacturers of drugs that they recommended” (
Shnier et al., 2016
Other considerations
- Most studies are industry funded, in some industries (Flacco et al., 2015; Shnier et al., 2016). Though it depends on which industry we’re talking about
In conclusion, funding is something to look out for, but it isn’t the end-all-be-all of whether we should reject a study (Resnik and Elliott, 2013). It’s equally important to identify: methodological quality, citations, journal, researcher background, what other studies conclude, etc. Furthermore, claiming that someone is biased is an assumption, and assumptions should be justified. If we can’t justify the answer beyond “all industry funded studies are biased” then we are on thin ice.
However, if a study exhibits several red flags like poor/biased methodology, unknown researchers, single funding by a company that produces/sells the product being tested, unknown journal, no citations, “extreme” results, then we can make a bias claim with much more certainty.
“Although it is widely acknowledged that financial interests can threaten the integrity of science, it is important to realize that having an economic stake in the outcome of a study does not automatically invalidate or taint one’s research. Most researchers with financial interests related to their work conduct good research, and most sponsors and institutions do not manipulate study design, execution, management, or oversight to promote their financial interests.”
Resnik, 2014
“At least five factors can be examined to determine whether financial relationships are likely to enhance, undermine, or have no impact on the credibility of research. These include as follows: whether sponsors, institutions, or researchers have a significant financial stake in the outcome of a study; whether the financial interests of the sponsors, institutions, or researchers coincide with the goal of conducting research that is objective and reliable; whether the sponsor, institution, or researchers have a history of biasing research in order to promote their financial goals; how easy it is to manipulate the research in order to achieve financial goals; and whether oversight mechanisms are in place which are designed to minimize bias. Since these factors vary from case to case, evaluating the impact of financial relationships depends on the circumstances”
Resnik and Elliott, 2013
Body composition measurement
Glycogen and gains: a confounder in beginner studies
This section is taken from our article on detraining.
The body composition measurement tools mentioned above are useful, but they are also affected by how much glycogen we store in our muscles. So when muscle glycogen stores shrink during detraining, we “lose” muscle mass, or more accurately, the water contents of our muscles decreases (Nygren et al., 2001).
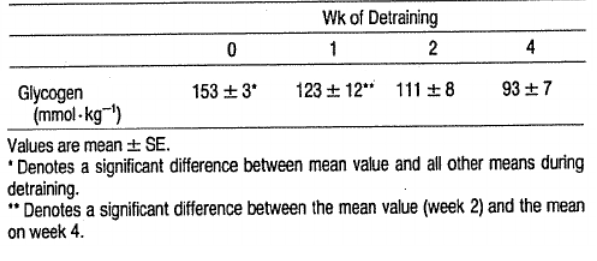
Glycogen depletion following 4 weeks of detraining in competitive swimmers (Costill et al., 1985)
When beginners start exercising, their muscle glycogen stores will grow quickly and they will retain more water, as shown below:
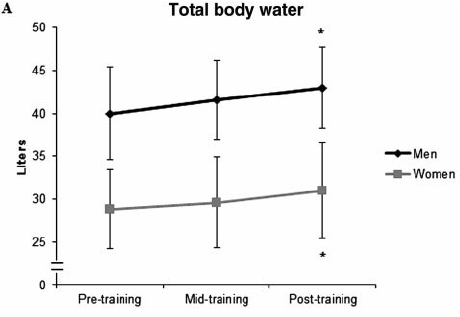
What 16 weeks of strength training does for total body water in beginners.
Figure by Ribero et al., 2014
If researchers were to measure gains after a couple weeks of training, it could simply be increased muscle glycogen. On the other hand, if researchers are using tools that can detect water changes within our bodies, then they can measure “real” gains much better (LaForgia et al., 1999; Mallinson et al., 2011). Indeed, a study found that endurance athletes lost muscle mass during a 3-week detraining period (LaForgia et al., 1999). However, the muscle mass loss was only found using measurement tools that weren’t ideal for the job (2 and 3 compartment models). Check out a comparison of the models below:

Figure by Mallinson et al., 2011
Luckily, the same researchers also measured water mass using a 4 compartment model. They found that the 0.7 kg loss of lean mass was actually a loss of 0.7 kg total body water. Hence, the detrained athletes didn’t lose any muscle mass during a three week break from training (LaForgia et al., 1999). But, their muscle glycogen stores did shrink.
This is why we have to take the atrophy and hypertrophy studies with a grain of salt.
However, let’s assume that 2-3 weeks detraining in beginners leads to muscle loss. Does it matter in the long-term? Studies by Ogasawara et al., 2011 and Ogasawara et al., 2013 suggest that it makes little difference:
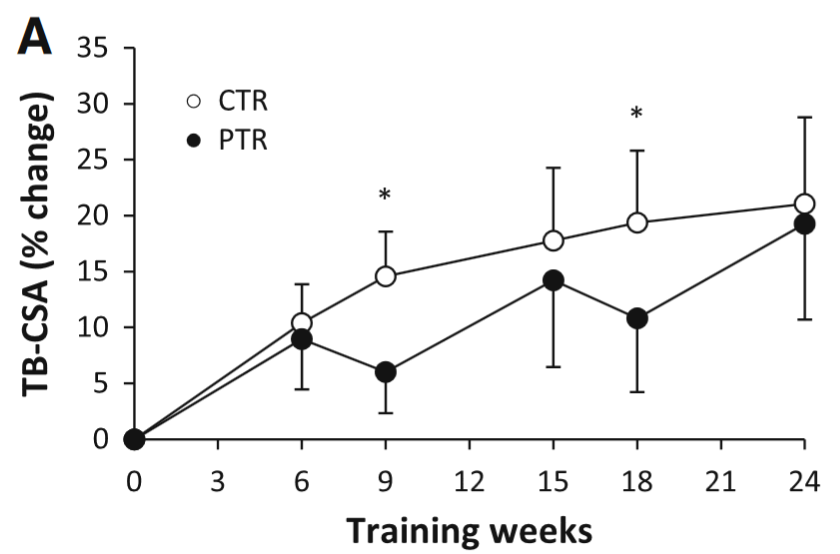
The figure shows how CSA [hypertrophy] changes over the course of 24 weeks of training. The black lines (PTR group) trained for 6 weeks, then took a break for 3 weeks (rinse and repeat). The white line (CTR group) trained continuously. By the end there was little change in gains. Note that the CTR group did a lot more volume because they never took a break: “the PTR group had 25 % fewer training sessions”. Figure by Ogasawara et al., 2013.
My bet is that muscle glycogen stores shrunk during the detraining phases, and rebounded during the training phases. Therefore, we are, to some extent, observing changes in muscle glycogen, not muscle mass. Though I don’t know exactly how much of the gains are glycogen gains compared to “dry” gains (the researchers didn’t control for body water). As you can see, the continuous group (CTR) made huge gains the first 6-9 weeks of training and then the curve becomes much flatter. I think this is because they made muscle gains and glycogen gains. Once the glycogen gains wear off, all we have is “pure” CSA gains.
Though I will write a counterpoint: Muscles can contain a maximum of 4g glycogen per 100g wet muscle (Hansen, 1999). Glycogen can bind 3g of water per gram (Ribero et al., 2014). So the maximum amount of glycogen + its bound water is:
4g + 4*3g
= 4g + 12g
= 16g (per 100g muscle).
The final answer is 16%. This shows us that glycogen and its bound water can’t make up huge changes in gains. But, it would explain small changes in muscle mass during detraining (for example a loss of 5-6% CSA as some studies have suggested (Hortobágyi et al., 1993; Ogasawara et al., 2013)). When it comes to filling muscles with glycogen, one study found that glycogen loading lead to a 3,5% CSA increase in untrained people (Nygren et al., 2001). Perhaps glycogen loading/depletion plays an even bigger “hypertrophic” role in people who have at least 10-16 weeks of resistance training experience?
Peer review, as good as it sounds?
When an article is released in a peer-reviewed journal, we automatically assume it is of high quality and trustable. However, I’d argue we need to question that assumption. In 2013, Bohannon sent a spoof-paper to 304 open-access journals.
He describes his article in the following way:
“[…] it should have been promptly rejected. Any reviewer with more than a high-school knowledge of chemistry and the ability to understand a basic data plot should have spotted the paper’s short-comings immediately. Its experiments are so hopelessly flawed that the results are meaningless.”
Bohannon, 2013
And it looks like few journals questioned the quality:
“Acceptance was the norm, not the exception. The paper was accepted by journals hosted by industry titans Sage and Elsevier. The paper was accepted by journals published by prestigious academic institutions such as Kobe University in Japan. It was accepted by scholarly society journals. It was even accepted by journals for which the paper’s topic was utterly inappropriate, such as the Journal of Experimental & Clinical Assisted Reproduction.
(…)
the flagship journal of the Public Library of Science, PLOS ONE, was the only journal that called attention to the paper’s potential ethical problems, such as its lack of documentation about the treatment of animals used to generate cells for the experiment. The journal meticulously checked with the fictional authors that this and other prerequisites of a proper scientific study were met before sending it out for review. PLOS ONE rejected the paper 2 weeks later on the basis of its scientific quality.
(…)
Of the 255 papers that underwent the entire editing process to acceptance or rejection, about 60% of the final decisions occurred with no sign of peer review. For rejections, that’s good news: It means that the journal’s quality control was high enough that the editor examined the paper and declined it rather than send it out for review. But for acceptances, it likely means that the paper was rubber-stamped without being read by anyone.
(…)
By the time Science went to press, 157 of the journals had accepted the paper and 98 had rejected it.”
Beyond this issue of sloppy peer review, we have the problem of researchers faking research or peer review:
- Statement of Retraction. Replication of Obesity and Associated Signaling Pathways Through Transfer of Microbiota From Obese-Prone Rats: (This article was out since 2014, but wasn’t retracted until 2016:)
“The lead and corresponding authors wish to retract the above-cited article as an institutional investigation has identified that co-author Yassine Sakar falsified [data].”
“Springer is pulling another 64 articles from 10 journals after finding evidence of faked peer reviews, bringing the total number of retractions from the phenomenon north of 230. Given that there have been about 1,500 papers retracted overall since 2012, when we first reported on the phenomenon, faked reviews have been responsible for about 15% of all retractions in the past three years.”
“In the past 2 years, journals have been forced to retract more than 110 papers in at least 6 instances of peer-review rigging. What all these cases had in common was that researchers exploited vulnerabilities in the publishers’ computerized systems to dupe editors into accepting manuscripts, often by doing their own reviews. The cases involved publishing behemoths Elsevier, Springer, Taylor & Francis, SAGE and Wiley, as well as Informa, and they exploited security flaws that — in at least one of the systems — could make researchers vulnerable to even more serious identity theft.”
In short, we shouldn’t automatically assume research is of high quality, even if it is published in major peer-reviewed journals. Maybe authors are looking for the next big break? Maybe they are willing to do what it takes to get recognition? I don’t know, but we need to be aware that forging data and poor peer review are potential problems.
Misrepresenting citations
After having read many studies on fitness and nutrition research, I’ve discovered that several researchers will miscite (misquote) different research papers. By that I don’t mean they make some formal error and get the citations wrong that way. I mean they will cite studies that do not support the argument they are making. They probably do this because they (1) haven’t looked at the studies in enough detail and it’s a mistake, or (2) they do it consciously and hope people won’t check. This article isn’t meant to call out anybody, so I won’t link any to specific examples. All I can say is, if you start digging, you might find something that’s off (Petrenuski et al., 2013; Hoffmaster et al., 2018). What this means in practice is that many conclusions will seem much more well-supported than they actually are. It’s also common to cite animal studies and use them as evidence for claims made about humans. See the animal studies section below for more details on this.
Poor methodology and reporting
Changing many variables at once
Quite often, studies will alter multiple independent variables (for example group A will do 5 sets of 10 reps to failure while group B does 2 sets of 5 reps to non-failure). The results come in and they show group A gained more mass. The authors might conclude from this that group A was superior because they went to failure. This might be partially true, but it could also be the case that group A did much more volume, and so the combination of more volume and going to failure lead group A to be “better”.
Ideally, you would keep everything the same between groups and only change one variable. A surprising amount of studies do not do this, and it confounds their results and conclusions. Though this doesn’t apply to studies that look at ecological validity, because then it’s often the case that many variables are changed at the same time. For example, an ecological study might compare two different strength training programs, they might be completely different in terms of reps, sets, rest periods, use of failure, exercises, time under tension, etc. This wouldn’t matter, because you’re trying to figure out which program is best as a whole, you’re not looking at each individual variable in isolation.
Improper randomization
“trials with inadequate or unclear randomization tended to overestimate treatment effects up to 40% compared with those that used proper randomization” (Kang et al., 2008).
In my experience, poor randomization isn’t as uncommon as it should be. In one study, women and men were unequally distributed between groups, which could influence results as per my discussion on sex differences.
No mention of adherence rates
As I’ve mentioned, adherence can be quite important, and if 30% of participants had less than say 60% adherence, then that is a big problem and it might influence the outcome. Adherence is a good measure of whether a program is unrealistic or not. High adherence means the program is probably relatively easy to follow and it might also motivate the participants. Very low adherence could mean the opposite.
Non-existent or flawed volume matching
When comparing two different strength training programs, it’s very important to match volume between the groups. This means that the groups should do the same number of hard sets to failure (Dankel et al., 2016) or at the very least go very close to failure. A hard set to failure ensures that all participants get about the same level of fatigue and stimulus from the exercise. There are other ways to match volume, but these are suboptimal:
Matching total tonnage
This method might sound convincing at first. We match the total number of kilos/lbs the participants lift per week, for example. However, this method is flawed: it’s very easy to hit high tonnages using low-load high-rep training, but much more fatiguing and difficult to hit the same tonnages with high-intensity high-load training. For example, let’s say you’re doing 5 sets of 10RM bench press compared to 5 sets of 5RM bench press. Let’s say you can do 100kg for 5 reps for 5 sets. That is 2500kg total tonnage per session. If you can do 70kg for 10 reps for 5 sets, then you’re doing 3500kg total tonnage per session.
There are several studies that show similar gains when you do the same number of hard sets to failure. So these two protocols should lead to about the same level of hypertrophy, while the 70kg group will improve their muscular endurance more than the 100kg group who, most likely, will improve their 1RM more. So it doesn’t matter if the total tonnage is different, because the stimulus to grow will be about the same. If researchers follow the total tonnage method, they will reduce sets or reps for the 70kg group so that they match the total tonnage of the 100kg group. This tonnage matching, will, perhaps paradoxically to some, favour the 100kg group!
Matching total repetitions
It should go without saying that a repetition at 30% 1RM provides a completely different stimulus compared to a repetition at 90% 1RM.
Matching total sets without controlling fatigue:
Let’s say a study matched total sets between groups. If one group goes to failure on every set, while the other doesn’t, we have some issues. The main issue being that the failure group would be getting a different stimulus compared to the non-failure group. This is good if the purpose of the study is to test the difference between failure and non-failure. But if that isn’t the purpose, then all sets should be taken to the same level of fatigue by all participants (i.e. RPE 9 or 10).
Here’s an example of a situation where it could be a good idea to match volume: frequency studies. Several studies test whether it would be best to train a muscle group once or twice a week. If volume isn’t matched, we don’t know whether the study outcomes were because of the volume difference or the frequency difference. It should be said that there are many studies that do not do any sort of volume matching! And if studies do match volume, they usually use the wrong method. Like measuring total tonnage, but not the number of hard sets to failure.
Statistics
Statistical power and low number of participants
Most strength training studies have anywhere from 6-20 participants. This diminished statistical power and it’s harder to show a true effect (Ellis, 2010; Button et al., 2013). In other words, the fewer participants in a study, the greater the differences between the groups need to be (Ellis, 2010). Since studies need a certain minimum level of power, some authors suggest doing a power analysis, because “studies that have too much or too little statistical power are inherently wasteful, and potentially misleading“ (Ellis, 2010). This also compounds on the duration issue (many studies have short durations).
“Power depends on several factors: magnitude of effect, sample size, N, and required level of statistical significance, α (the false-positive, or type I, error rate). Although N and α are determined by the experimenter, many of the factors that contribute to the effect size are typically unknown. In order to compute power, we are therefore required to make assumptions regarding what we expect to find.” (Purcell et al., 2003)
The graph below shows us how the sample size (number of participants) is connected to power and effect size (the magnitude of the difference):
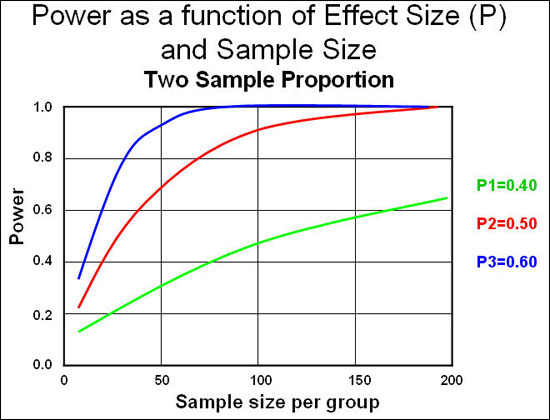
Source: Epiville
As you can see, power is very low when we have 10 participants per group (which is standard in fitness research) and we need to see very large effect sizes (differences between groups) to reach statistical significance. If we follow convention and aim for 80% (0.8) power, we need large effects or large sample sizes. In fitness research the effects are usually small, and so are the sample sizes. Hence we aren’t likely to detect a difference between groups even if it exists.
Here’s a video that explains this:
Correlations and outliers
“Outliers can have a very large effect on the line of best fit and the Pearson correlation coefficient, which can lead to very different conclusions regarding your data. This point is most easily illustrated by studying scatterplots of a linear relationship with an outlier included and after its removal, with respect to both the line of best fit and the correlation coefficient. This is illustrated in the diagram below:”
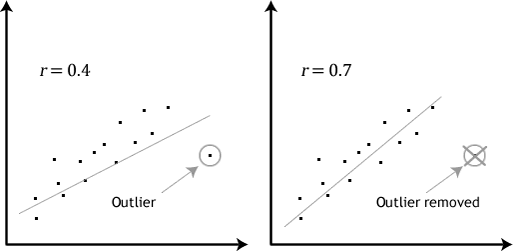
Source (quote and image): Laerd statistics
Statistical significance vs. clinical significance
Statistical significance does not automatically translate to real-world significance or clinical significance (Bhardwaj, 2004; Ellis, 2010):
“An assessment of study power is essential in determining both the statistical significance and clinical relevance of any study and has serious implications for any conclusions that can be drawn. Consequences of an inappropriate sample size can be dangerous in either extreme. An excessively large sample may show statistical significance even when there is no clinical practicality; an inappropriately small sample will fail to demonstrate important clinically significant differences.”
Bhardwaj, 2004
“The widespread practice of interpreting p values as evidence in support of hypothesized effects constitutes a blatant disregard for the limitations of statistical significance testing.”
Ellis, 2010
Publication bias
Publication bias is when studies get “trashed” if they don’t confirm a hypothesis (Dickersin et al., 1987; Fisher and Steele, 2012; Dwan et al., 2013; Song et al., 2014; Simonsohn et al., 2014). We then only get to see all the published studies that show a strong result, but not all the perfectly fine, but unpublished studies that had negative results. This could give us the impression that an effect is much stronger or more real than it really is.
Animal studies
I’m not even sure this needs to be mentioned, but animal studies are frequently used to make quite extraordinary claims about humans. There might be some overlap between species, but we shouldn’t assume that results of animal studies apply to humans (Shanks et al., 2009; Uhl and Warner, 2015). If we do claim that an animal study applies, we need to justify it. It’s already difficult enough to compare different phenotypes within the species. How can we expect to compare different phenotypes across species with great accuracy?
“Experimental animal models are not fully reliable [but] reproduce at least some aspects of human disease. Expression and activation pattern of AMPK isoforms differs between rodent and human muscle and between muscle fiber types (149, 150). Furthermore, sex difference in muscle AMPK activation has been observed in humans, probably due to sex specific muscle morphology (higher proportion of type 1 muscle fibers in women)” (Viollet et al., 2009)
Other factors that can affect study outcomes
- Different limbs have different fiber type compositions. Muscle biopsies done on only one leg could affect outcomes (Arevalo et a., 2016)
- Determining CSA using MRI is imperfect (it measures intramuscular fat including FFM) (Sions et al., 2017). This is primarily an issue in aging individuals (McGregor et al., 2014). Muscles generate less force per unit of CSA with age (Mitchell et al., 2012; McGregor et al., 2014)
- Ambient conditions like temperature, noise levels, humidity etc. are not stated but could affect results (Halperin et al., 2015)
- Day and time of training should be stated (Halperin et al., 2015)
- Asking all participants to use the same number of reps as calculated from 1RM is not ideal (high individual variability) (Arazi and Asadi, 2011; Richens and Cleather, 2014; Dankel et al., 2016)
- ^Therefore, sets should be taken to failure to ensure uniform stress in all groups (Dankel et al., 2016)
- Measuring strength via peak torque, RFD, or isometric strength instead of “real world” 1RM improvements
- Using 2 or 3 compartment body analysis models like BIA to measure hypertrophy, not controlling water.
- Participants are sometimes classified as “resistance trained” in studies. But the standards scientists use for being resistance trained are much lower than what coaches would use. For example, researchers will describe a person as resistance trained if they have been doing strength training for one year. They sometimes measure how strong the person is at baseline, but rarely any sort of minimum strength criteria. Meaning, training time in months is usually the only criteria they use for being trained.
- Drugs: participants could’ve been on steroids years before or during the study (however some studies test for current drug usage during participant sampling).
- Experience: Some studies require participants to have strength training experience for x amount of years. This can’t be controlled and relies on the participant honestly recollecting his past training. Also, two people who have been training for the same amount of time could’ve had vastly different diets, training programs, etc. So time isn’t the best indicator for gains. You could be spinning your gears for a year or make serious progress.
- No mention of drop-outs in abstract: Several studies have had substantial drop outs during their intervention period, but some do not mention this in the abstract. This leads the reader to think the studies had more participants than what the study really had.
“To maintain a high degree of internal validity in performance and physiological testing , special consideration is warranted to reduce the risk of confounding variables affecting outcome measures . The sports science researcher and/or practitioner should typically control for age and gender of the subjects, caffeine and nutrient intake prior to testing, hour of the day and ambient temperature. Moreover, the effects of attentional focus, knowledge of exercise endpoint, verbal encouragement, positive and negative feedback, number and gender of observers, music and mental fatigue should also be considered given their meaningful effects on physical performance.”
Halperin et al., 2015
Sci-Fit’s interpretation of the literature
Standards of evidence
Generally speaking, we should have high standards for what we consider solid evidence. I generally want to see at least three different RCTs with human participants, solid methodologies, sufficient durations, done by different research teams. At this point, we can start to talk about whether an outcome is likely to be true, valid, and applicable to humans. Though that’s just the starting point. Ideally, we’d want to see even more studies and have them put into context via systematic reviews and meta-analyses.
Speculation and extrapolation
Since the literature is imperfect and limited, we are forced to speculate to some extent. I’ve consciously tried to minimize speculation as much as possible in my articles, but in some topics it’s inevitable that I have to mix real-life experience with the data from the research. This isn’t purely a limitation though, because scientific data needs to be placed in a real-life context to be useful. And there are very few studies that take into account whether the study protocol would work well in real life (see “ecological validity” for more info).
Scientific research deals with probabilities
Scientific studies can provide probabilistic support (with varying levels of quality and certainty) for a hypothesis or theory. Science can’t “prove” anything because a scientific field is not a homogeneous entity, nor does its answers exist in absolutes. When we say something is “proven” it implies it can’t change. It implies it is indisputable. In scientific fields, there are numerous research teams with multiple competing hypotheses, theories, data, etc. At any given time we can discuss which theory has the most support, but in science, theories evolve over time. Sometimes they are replaced entirely.
“Scientific knowledge is inherently uncertain: experimental observations may be corrupted by noise, and no matter how many times a theory has been tested there is still the possibility that new experimental observations will refute it — as famously happened to Newtonian mechanics. Probability theory has from its conception been utilized to represent this uncertainty in scientific knowledge.”(Soldatova et al., 2013)
Conclusion – How to apply research to your life
From the information presented in this article, I think it’s safe to conclude that we should be very careful about interpreting research. There are many reasons why studies don’t directly apply to our lives. Scientific studies can provide probabilistic support (with varying levels of quality) for a hypothesis or theory.
This begs the question: how can we apply the research to our lives?
To figure out whether something applies to us, we need to critically analyse the literature in its totality. Looking at one study in isolation is never enough. We should always strive to review the most relevant and important literature on any given topic and try to determine the preponderance of the evidence.
After we’ve looked at the literature and considered the drawbacks of every study, we can finally start to get a glimpse of what the truth could be. We then have to use our knowledge, experience, and intuition to apply what is done in the lab, to real life.