Keto Flush – How Body Water and Glycogen Affect Ketogenic Weight Loss

Written by 
Adam Tzur

Acknowledgements
Brandon Roberts 

Reviewed by
Michael Hull, Zad Chow, and Grant Tinsley.

Published: August 2, 2018


Keto Flush Sci-Fit

Plain Language Summary

Keto Flush Explained

When you start the ketogenic diet, certain changes happen in your body:

  • Body water decreases
  • Glycogen stores shrink
  • Salt is expelled from the body, creating a dehydrating effect
  • Lean body mass 1Lean Body Mass (LBM) is the weight of your body that is not fat. It typically includes water, tissue, and bones. decreases

These changes happen when carbohydrates are limited in supply and because ketones expel water. Body weight will decrease as a result, and we can refer to this as wet weight. This dehydration may make you look deflated because muscle mass contains a lot of water. Less water and glycogen in the muscle reduces its size.

We coin these effects: keto flush.

However, keto flush is temporary, preventable, and reversible.

Preventing Keto Flush

You can prevent keto flush by:

Reversing Keto Flush

It is easy to reverse keto flush. Simply consume more carbohydrates and exit ketosis. This will lead to glycogen supercompensation where glycogen stores are filled beyond their normal non-ketogenic levels. You should expect to gain a couple kgs of wet weight.

Losing Muscle Mass?

When keto flush takes place, you will naturally “lose” lean body mass. But, does that imply that muscle mass is lost on the diet? Not necessarily, because water and glycogen are part of lean body mass in most methods that assess body composition.

Hence, we should not assume that this is muscle atrophy (unless you want to equate a transient reduction in wet mass with atrophy).

Weight Loss vs. Fat Loss

Keto flush has several implications. One of those is that you should not trust the weight scale entirely. A rapid drop in weight does not imply that you’ve only lost body fat. You should expect to lose 1–5 kgs of wet weight during the first weeks of a ketogenic diet (depending on how many steps you’ve taken to prevent keto flush). You can still burn fat effectively during keto flush, and the ketogenic diet is generally good at reducing hunger.

What is Keto Flush?

The Role of Glycogen

Glycogen is the body’s stored carbohydrate. It is mainly found in muscles (~350–700 g) and the liver (~100 g) (Knuiman et al., 2015). The body uses glycogen during exercise, and the more intense the exercise, the more glycogen is used (Knuiman et al., 2015). 4 grams of water are stored alongside every gram of glycogen.

We can reduce glycogen stores by:

  • Fasting
  • Restricting carb intake (i.e. the ketogenic diet)
  • Exercising

Glycogen stores shrink on the ketogenic diet

Since the ketogenic diet restricts carbohydrates, glycogen and water stores drop. This can be seen in the figure and table below:

Bogardus et al., 1981 - keto and muscle glycogen - edited

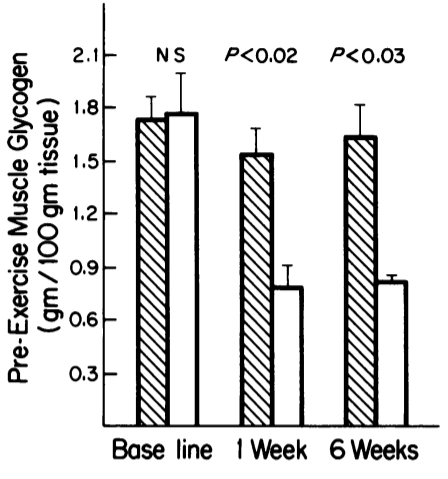
Resting muscle glycogen levels are more than halved on a keto diet (white bars) vs normal diet (striped bars).
Figure by Bogardus et al., 1981.


Per the table below, glycogen stores are reduced by 20–54% after 1–6 weeks on the ketogenic diet.

Study Glycogen Lean Body Mass/ Fat-Free Mass
Phinney et al., 1980

Untrained, obese subjects

Week 1:

0.87 mg/100 g wet wt (−43% from baseline)

Week 6:

1.04 mg/100 g wet wt (−21% from baseline)

Phinney et al., 1983

Trained cyclists

Week 4:

0.76 mg/100 g wet wt (−54% from baseline)

Bogardus et al., 1981

Untrained, obese women

Week 1:

0.81 mg/100 g wet wt (−54% from baseline)

Week 6:

0.86 mg/100 g wet wt (−51% from baseline)

Lambert et al., 1994

Trained cyclists

Week 2:

Approx. 0.7 mmol/kg

Krotkiewski et al., 2000

Women

Week 2:

−40% from baseline

Week 2:

-2.4 kg

Harber et al., 2005

Metabolic ward

Week 1:

−20% from baseline

“In humans, most glycogen is made and stored in cells of the liver (~100 g) and muscles (~350 – 700 g; depending on training status, diet, muscle fibre type composition, sex and bodyweight) and can be reduced by fasting, low intake of dietary carbohydrates and/or by exercise.” - Knuiman et al., 2015

“ ... glycogen availability is essential to power ATP resynthesis during high intensity exercise which relies heavily on glycogenolysis.” - Knuiman et al., 2015

“The apparent paradox that ad-libitum intake of high-fat foods produces weight loss might be due to severe restriction of carbohydrate depleting glycogen stores, leading to excretion of bound water” - Astrup et al., 2004

Does glycogen come back?

Please read the relevant sections on habituation to the diet and carb refills [Internal links]

Water and Salt Loss

The ketogenic diet leads to ketosis-induced diuresis (Miller et al., 2004; Pogozelski et al., 2005).

“[Diuresis] — an increased excretion of urine” - Merriam-Webster

In other words, the ketogenic diet has a dehydrating effect. The dehydration happens in part because more salt is released from the body, alongside glycogen and water (as described in the previous section) (Denke, 2001; Miller et al., 2004; Pogozelski et al., 2005). We can see this effect in the figure below, where ketosis leads to a large reduction in the total body water of the participants.

Gomez-Arbelaez et al., 2017 - Water (Edited)

Figure: Gomez-Arbelaez et al., 2017 (edited for clarity).
Participants were obese patients.


Per the table below, total body water is reduced by ~1–5 kg after 1–8 weeks on the ketogenic diet.

Study Total Body Water Lean Body Mass/ Fat-Free Mass
Vargas et al., 2018
Resistance trained men (8 weeks)
  −0.3 kg
Yang and Itallie, 1976

Obese men, metabolic ward (10 days)

Approx. −4.8 kg

(estimated from graph)

Johnstone et al., 2008 Week 4:

−0.95 kg

Week 4:

−1.2 kg

Sawyer et al., 2013 Week 1:

−0.84 kg (men)

Week 1:

−1.13 kg (men)

Gomez-Arbelaez et al., 2017

Obese patients

Maximum ketosis

−2.3 kg

Ketosis declining

−2.1 kg

Out of ketosis

−1.8 kg

Maximum ketosis

−4.2 kg

Ketosis declining

−4.4 kg

Out of ketosis

−3.7 kg

Colica et al., 2017

VLCKD1 group

Week 3:

−1.55 kg

Table: total body water is reduced in ketogenic diet studies.
Glycogen may be part of the LBM calculation, so it is important to also look at LBM for reduction in wet weight caused by keto flush.


“Ketone bodies are filtered by the kidney as nonreabsorbable anions. Their presence in renal lumenal fluids increase distal sodium delivery to the lumen, and therefore increase renal sodium and water loss” - Denke, 2001


“ ... the unanticipated additional weight loss is consistent with the 1–2-kg weight loss seen with glycogen mobilization (in liver and muscle) and ketosis-induced diuresis (increased delivery of sodium to distal lumen of the kidney by non-reabsorbable ketones inducing water loss) that occurs with LC diets. 34,35” - Miller et al., 2004

“Ketosis also causes water loss. The kidney filters ketones as anions, increasing distal sodium delivery to the lumen and causing diuresis [14].” - Pogozelski et al., 2005

“The high-protein, low-carbohydrate dieting resulted in substantial weight loss, probably due to a combination of salt and water loss, as well as caloric restriction” - Larosa et al., 1980

Does Keto Flush Lead to an Illusion of Rapid Fat Loss?

No doubt, you can use the ketogenic diet to reduce hunger and eat less. This in turn will help you burn body fat.

However, it is important that you’re aware of keto flush. The first time you start on a ketogenic diet, you will likely experience rapid weight loss. This might feel like the diet is burning off fat, but the weight loss is also due to glycogen, salt, and water losses.

Several research teams expect people to lose anywhere from 1–5 kg of wet weight in the first week(s) of the ketogenic diet (Kreitzman et al., 1992; Bilsborough and Crowe, 2003; Miller et al., 2004). In other words, weight that is not fat mass.

You can see studies that reported water loss in the table above [internal link].

“Glycogen losses or gains are reported (2) to be associated with an additional three to four parts water, so that as much as 5 kg weight change might not be associated with any fat loss. As glycogen stores are readily replenished after conclusion of any weight-loss program, it is necessary to account for these losses before comparing effectiveness of weight-loss methods, before assessing recidivism, and certainly before criticizing dieters for lack of post-diet control.” - Kreitzman et al., 1992

“As each gram of glycogen is bound with 3g of water, then a simple calculation shows that a ‘weight loss’ of around 1-2kg can be achieved within the first week of the diet, albeit due to diuresis and not to the burning of fat stores.” - Bilsborough and Crowe, 2003

“Of importance is that a proportion of the BW reduction in the low-carbohydrate/high-protein diet group may have been attributable to body water losses associated with glycogen depletion (13), particularly in the first week of dietary intervention.” - Nickols-Richardson et al., 2005

“ … the unanticipated additional weight loss is consistent with the 1–2-kg weight loss seen with glycogen mobilization (in liver and muscle) and ketosis-induced diuresis (increased delivery of sodium to distal lumen of the kidney by non-reabsorbable ketones inducing water loss) that occurs with LC diets. 34,35” - Miller et al., 2004

Why Keto Flush Makes You Look Deflated

Fat-free mass is mostly water. On average, it is ~73-74%, but the full range in humans is ~69–81% (Wang et al., 1999; Roumelioti et al., 2018). So it should come as no surprise that muscle mass also consists of water and protein. Though, it also contains fat (intramuscular triglycerides), glycogen, and other substances.

When muscle hydration changes, so does muscle size (Nygren et al., 2001; Bone et al., 2016). And as we know, the ketogenic diet reduces intramuscular water and glycogen. Hence, keto flush can make muscles look smaller, but it could also have the positive effect of reducing general bloating.

Gomez-Arbelaez et al., 2017 FFM (Edited)

4.2 kg of Fat-free mass is lost on a ketogenic diet. Figure by Gomez-Arbelaez et al., 2017


“In summary, both in vitro and in vivo studies make major contributions to the investigation of FFM hydration. In vitro studies reveal that FFM hydration of ≈0.73 is a universal body-composition rule that applies widely in mammals” - Wang et al., 1999

“Body water occurs almost exclusively in the fat-free mass component. When the water balance is normal, the water content of fat-free mass is at or very close to 73%[75-77]. Thus, determining whether TBW is within the normal range or not requires measurement of both fat-free mass and TBW.” - Roumelioti et al., 2018

“In the 4-compartment model used, glycogen is considered part of the fat-free mass, and it cannot easily be directly measured.” - Johnstone et al., 2008

“For the average adult man and woman weighing 70 kg, water constitutes approximately 60% and 55%, respectively, of body weight.” - Martinoli et al., 2003

“The CSA and T2 of thigh and calf muscles were related to the intramuscular glycogen content evaluated at days 4 and 8. An increase in glycogen content from 281 to 634 mmol kg(-1) dry wt increased the CSA of the vastus muscles by 3.5%” Nygren et al., 2001

You can Prevent and Reverse Keto Flush

Habituation to the diet

We have reason to believe that the body adapts to the ketogenic diet. With time, glycogen stores may return to normal.

“... initial depletion of muscle glycogen induced by the [ketogenic diet] may be at least partially reversed through habituation to the diet.” - Schick, 2016

For example, keto-adapted endurance athletes had normal muscle glycogen levels in Volek et al., 2016. During exercise, their glycogen utilization was similar to the control group, but their glucose oxidation was much lower.

"... the LC athletes had similar rates of glycogen repletion compared to the HC athletes, despite receiving a negligible amount of carbohydrate after exercise (4 vs 43 g) ..." - Volek et al., 2016

We also see that glycogen stores refill over a couple of weeks on the ketogenic diet, such as in Phinney et al., 1980. However, this is not supported by all studies.

One of the mechanisms here is that carbohydrate oxidation decreases so that glucose can be more readily taken up and be converted to glycogen (Harber et al., 2005). The body seemingly adapts by preserving glycogen stores (Schick, 2016).

“KD-adaptation has been shown to preserve liver and muscle glycogen during exercise; KD- adapted rats and trained humans have been shown to exhibit reduced exercising muscle and liver glycogen degradation rates without sacrifice to endurance performance (20-22, 29, 35, 36)” - Schick, 2016

“ ... initial depletion of muscle glycogen induced by the KD may be at least partially reversed through habituation to the diet.” - Schick, 2016

“ ... we show for the first time that chronic keto-adaptation in elite ultra-endurance athletes is associated with a robust capacity to increase fat oxidation during exercise while maintaining normal skeletal muscle glycogen concentrations.” - Volek et al., 2016

“Because the decline in carbohydrate oxidation was greater than the reduction in glucose uptake, a larger proportion of glucose taken up was converted to glycogen rather than being oxidized.” - Harber et al., 2005

“Resting vastus lateralis glycogen content fell to 57% of baseline after 1 wk of the PSF, but rose to 69% after 6 wk, at which time no decrement in muscle glycogen was measured after >4 h of uphill walking.” - Phinney et al., 1980

Strength Training to Retain Glycogen and LBM

Many studies report that the ketogenic diet leads to loss of lean body mass. The good news is that this is to a large extent water and glycogen.

One way to partially prevent glycogen loss, is to do strength training. This is because it leads to glycogen and water gains in both the short and long-term.

“[strength training] induces ... a rise in cellular hydration.” - Riberio et al., 2017

Per the graph below, we see studies where subjects were able to maintain or increase lean body mass with strength training on a ketogenic diet. However, several of the studies have major methodological and data reporting issues. Some studies also find that lean mass is reduced, even with strength training.

Sci-fit LBM graph ketogenic diet studies with resistance training


Carb refill and supercompensation

We can increase low glycogen stores by eating more carbohydrates. This will lead to a supercompensation effect. Check out the figures by Toomey and Wilson below to see this effect in action.

Toomey 2018 glycogen supercompensation

Figure by Toomey et al., 2017.


Wilson et al., 2017 lbm

Figure by Wilson et al., 2017.
The keto group (red) increased carb intake between weeks 10 and 11, and supercompensated glycogen stores. Hence, a very large increase (+3 kg) in lean body mass.


“The glycogen concentration in the thigh and the arm muscles was 4.5 and 2.6 g/kg wet muscle on the 3rd day and increased with the carbohydrate enriched diet to 19.9 and 16.9 g/kg wet muscle, respectively. Body weight increased 2.4 kg during this period of 4 days. The total body water increased 2.2 which is assumed to be caused by the glycogen storage in the muscles and the liver.” - (Olsson and Saltin, 1970)

“The excretion of sodium and water from the body can be inhibited by dietary carbohydrate. Bloom has shown that the weight loss of fasting can be decreased or abolished by the sodium and water retention that occur after ingestion of 600 kcal of carbohydrate.” - Council on Foods and Nutrition, 1973

“The only notable phenomenon after the diet was a transient 2-5 kg weight gain in the first three days, most likely caused by the combined antinatriuretic effect of reversing ketosis and glycogen supercompensation.” - Phinney et al., 1983

“Bergstrom and Hultman (1966) had already shown that consumption of a diet rich in carbohydrate for a few days after exercise-induced glycogen depletion resulted in a rapid resynthesis of the glycogen stores; after 2-3 days on the high-carbohydrate diet, muscle glycogen content, in those muscles which had been exercised, was about 2-3 times greater than the resting value” - Maughan et al., 1997

“The CHO-loading protocol increased muscle glycogen by 1.79 times baseline, and muscle glycogen remained near this level during the 3-day postloading period. Results indicate that supercompensated muscle glycogen levels can be maintained for at least 3 days in a resting athlete when a moderate-CHO diet is consumed.” - Goforth et al., 1997

“Supercompensation induced a mean body mass increase of 2.53 kg (2.0, 3.1) and a total LTM increase of 2.36 kg (1.8, 2.9).” - Toomey et al., 2017

Salt and Creatine

Finally, you should consider increasing mineral intake and supplementing creatine. Creatine leads to greater intramuscular water retention. You will also need to drink more water if you’re going to do this.

A Call to Action for Researchers

Fat Loss is Superior to Weight Loss

While the weight scale has its use, it is also limited. The scale does not distinguish between fat mass and fat-free mass. It cannot inform you of how much body fat participants have lost. It can give you a proxy, but it is imperfect.

Therefore, researchers should favor fat loss estimation over weight loss in ketogenic trials. Studies, meta-analyses, or reviews should be careful about making conclusions about a diet’s efficacy from weight loss data. Especially if there is no fat loss data available, and if the comparison is between a glycogen reduced group, and a normal group.

How To Measure Changes in Muscle Mass in Ketogenic Studies?

DXA is not perfect (Toombs et al., 2012).

As we’ve discussed at length in this article, the ketogenic diet will dehydrate the fat-free mass component of the body, thus reducing its water percentage, which is typically assumed to be constant at ~73–74% (Wang et al., 1999; Toomey et al., 2017; Roumelioti et al., 2018).

When DXA calculates lean soft tissue, it uses assumptions about tissue hydration, and when those assumptions are violated, the estimations become erroneous (St-Onge et al., 2004; Toomey et al., 2017). Notably, FFM hydration is not constant (St-Onge et al., 2004), and it can be manipulated by diets, fasting, or exercise (Knuiman et al., 2015; Toomey et al., 2017; Bone et al., 2017).

“... Fat-free mass is routinely measured by BIA or DEXA; however, these methods have hidden drawbacks. For example, an important assumption of the DEXA measurement of fat-free mass is that it contains 73% water” - Roumelioti et al., 2018

In fact, it can be questioned whether glycogen-reduced subjects should be compared to their own baseline or even to other groups consuming high-carbohydrate diets (Tinsley and Willoughby, 2016). Several researchers now call for control of hydration and glycogen levels (Toomey et al., 2017).

Suggestions for how to make the comparison fair:

Possible solutions Strengths Limitations
Carb refeed the participants a couple of days before the scans/measurements. Quick, easy. Glycogen supercompensation will distort LBM
Wait for long-term adaptation of glycogen stores (duration unknown) A more accurate comparison between groups. Long studies are expensive and may have issues with participants dropping out
Slowly increase carbohydrate intake over 2+ weeks before scans/measurements. May potentially prevent glycogen supercompensation. Requires stringent control of carbohydrate intake.
Measure LBM in the ketogenic diet group 2 weeks after they have initiated the diet. Then, compare week 2 (glycogen reduced baseline) to week [x] at the end of the trial. Avoids the issue of comparing participants with normal glycogen levels to those that are reduced. If real decreases in LBM/protein content occur in the first 2 weeks, these will not be picked up when week 2 is compared to the end of the trial.
Estimate TBW separately using a 4 component model Ability to control for water losses. Expensive and more time consuming. Even if TBW is measured, glycogen is part of LBM and thus still affects the measurement.

“Hydration of the DEXA-derived [LBM] compartment is thus not constant but varies predictably with [extracellular water] and [intracellular water] distribution. This observation has implications for the accuracy of body fat measurements by DEXA and the use of TBW as a means of checking DEXA system calibration.”

“Earlier studies have examined the effects of hydration on DEXA system fat estimates (10, 25). DEXA fat estimation errors occur as a function of added fluid “R value” (ratio of soft tissue attenuation) and the fraction of added fluid (21). The R value depends on fluid elemental content and is similar, although not identical, for ECW (1.377 at 40 and 70 KeV) and ICW (1.382). If the accumulating fluid has the same R value as LST and there is no R value difference, no fat estimation errors occur no matter how much extra fluid is added. If the hydration fluid and lean R values do differ, then greater relative fluid accumulation is associated with larger fat estimation errors.” - St-Onge et al., 2004

“Because hydration does not normalize after weight loss, all two-component models have a systematic error in weight-reduced subjects. The bias between 4C model and DXA was mainly explained by FM% at baseline, whereas FFM hydration contributed to additional 5%. As to the regional changes in body composition, DXA data had a considerable bias and, thus, cannot replace MRI.” - Pourhassan et al., 2013

“ ... the effect of an acute high carbohydrate diet seems to affect body composition values using DXA, such as total LBM. This study may lead to the need of standardizing a diet prior to using DXA.” - Rouillier et al., 2015

“Because glycogen and water are both components of DXA’s lean soft tissue measurement, it is worth considering whether estimations of body composition in individuals who may have altered glycogen concentrations can be accurately compared with those in nondepleted individuals (e.g., comparisons of body composition changes in low-carbohydrate vs. low-fat groups).” - Tinsley and Willoughby, 2016

“A substantial decrease in leg lean mass was observed following the glycogen depleting condition (-1.4 ± 1.6 %). Total body water showed substantial increases following glycogen loading (2.3 ± 2.3 %), creatine loading (1.4 ± 1.9 %) and the combined treatment (2.3 ± 1.1 %). Conclusions: Changes in muscle metabolites and water content alter DXA estimates of lean mass during periods in which minimal change in muscle protein mass is likely. This information needs to be considered in interpreting the results of DXA-derived estimates of body composition in athletes.” - Bone et al., 2017

“Euhydration or ‘normal’ total body water (TBW) content is required for accurate DXA body composition measurement, and is thought to maintain relative stability throughout the adult lifespan (Lohman et al. 2000; Schoeller 1989). DXA-based measurement of fat-free mass (FFM) assumes a constant water content of FFM (TBW/ FFM) at 0.73±0.03 (Moore and Boyden 1963; Wang et al. 1999). With standardised ranges established for the adult population (0.71–0.75), values outside these ranges would be defined as overhydrated or dehydrated (Lohman et al. 2000).” - Toomey et al., 2017

“Of relevance to DXA measurement, any state of abnormal hydration can alter the LTM attenuation coefficient, which in turn leads to an error in the amount of lean tissue attributed to each pixel (Roubenoff et al. 1993). Therefore, close regulation of hydration status in athletes is required prior to the measurement of body composition by DXA.” - Toomey et al., 2017